
The execution graph
Every skill.yaml has a live execution graph: a first-class visual surface that shows
the skill’s steps as connected nodes and lights them up as the skill runs. It is the
fastest way to understand a skill’s control flow, watch a run unfold, and inspect what each
step actually saw and produced.
Open it from the “Show Graph” CodeLens above any skill.yaml, then
run the skill from @skiller chat — the graph and the run are connected.
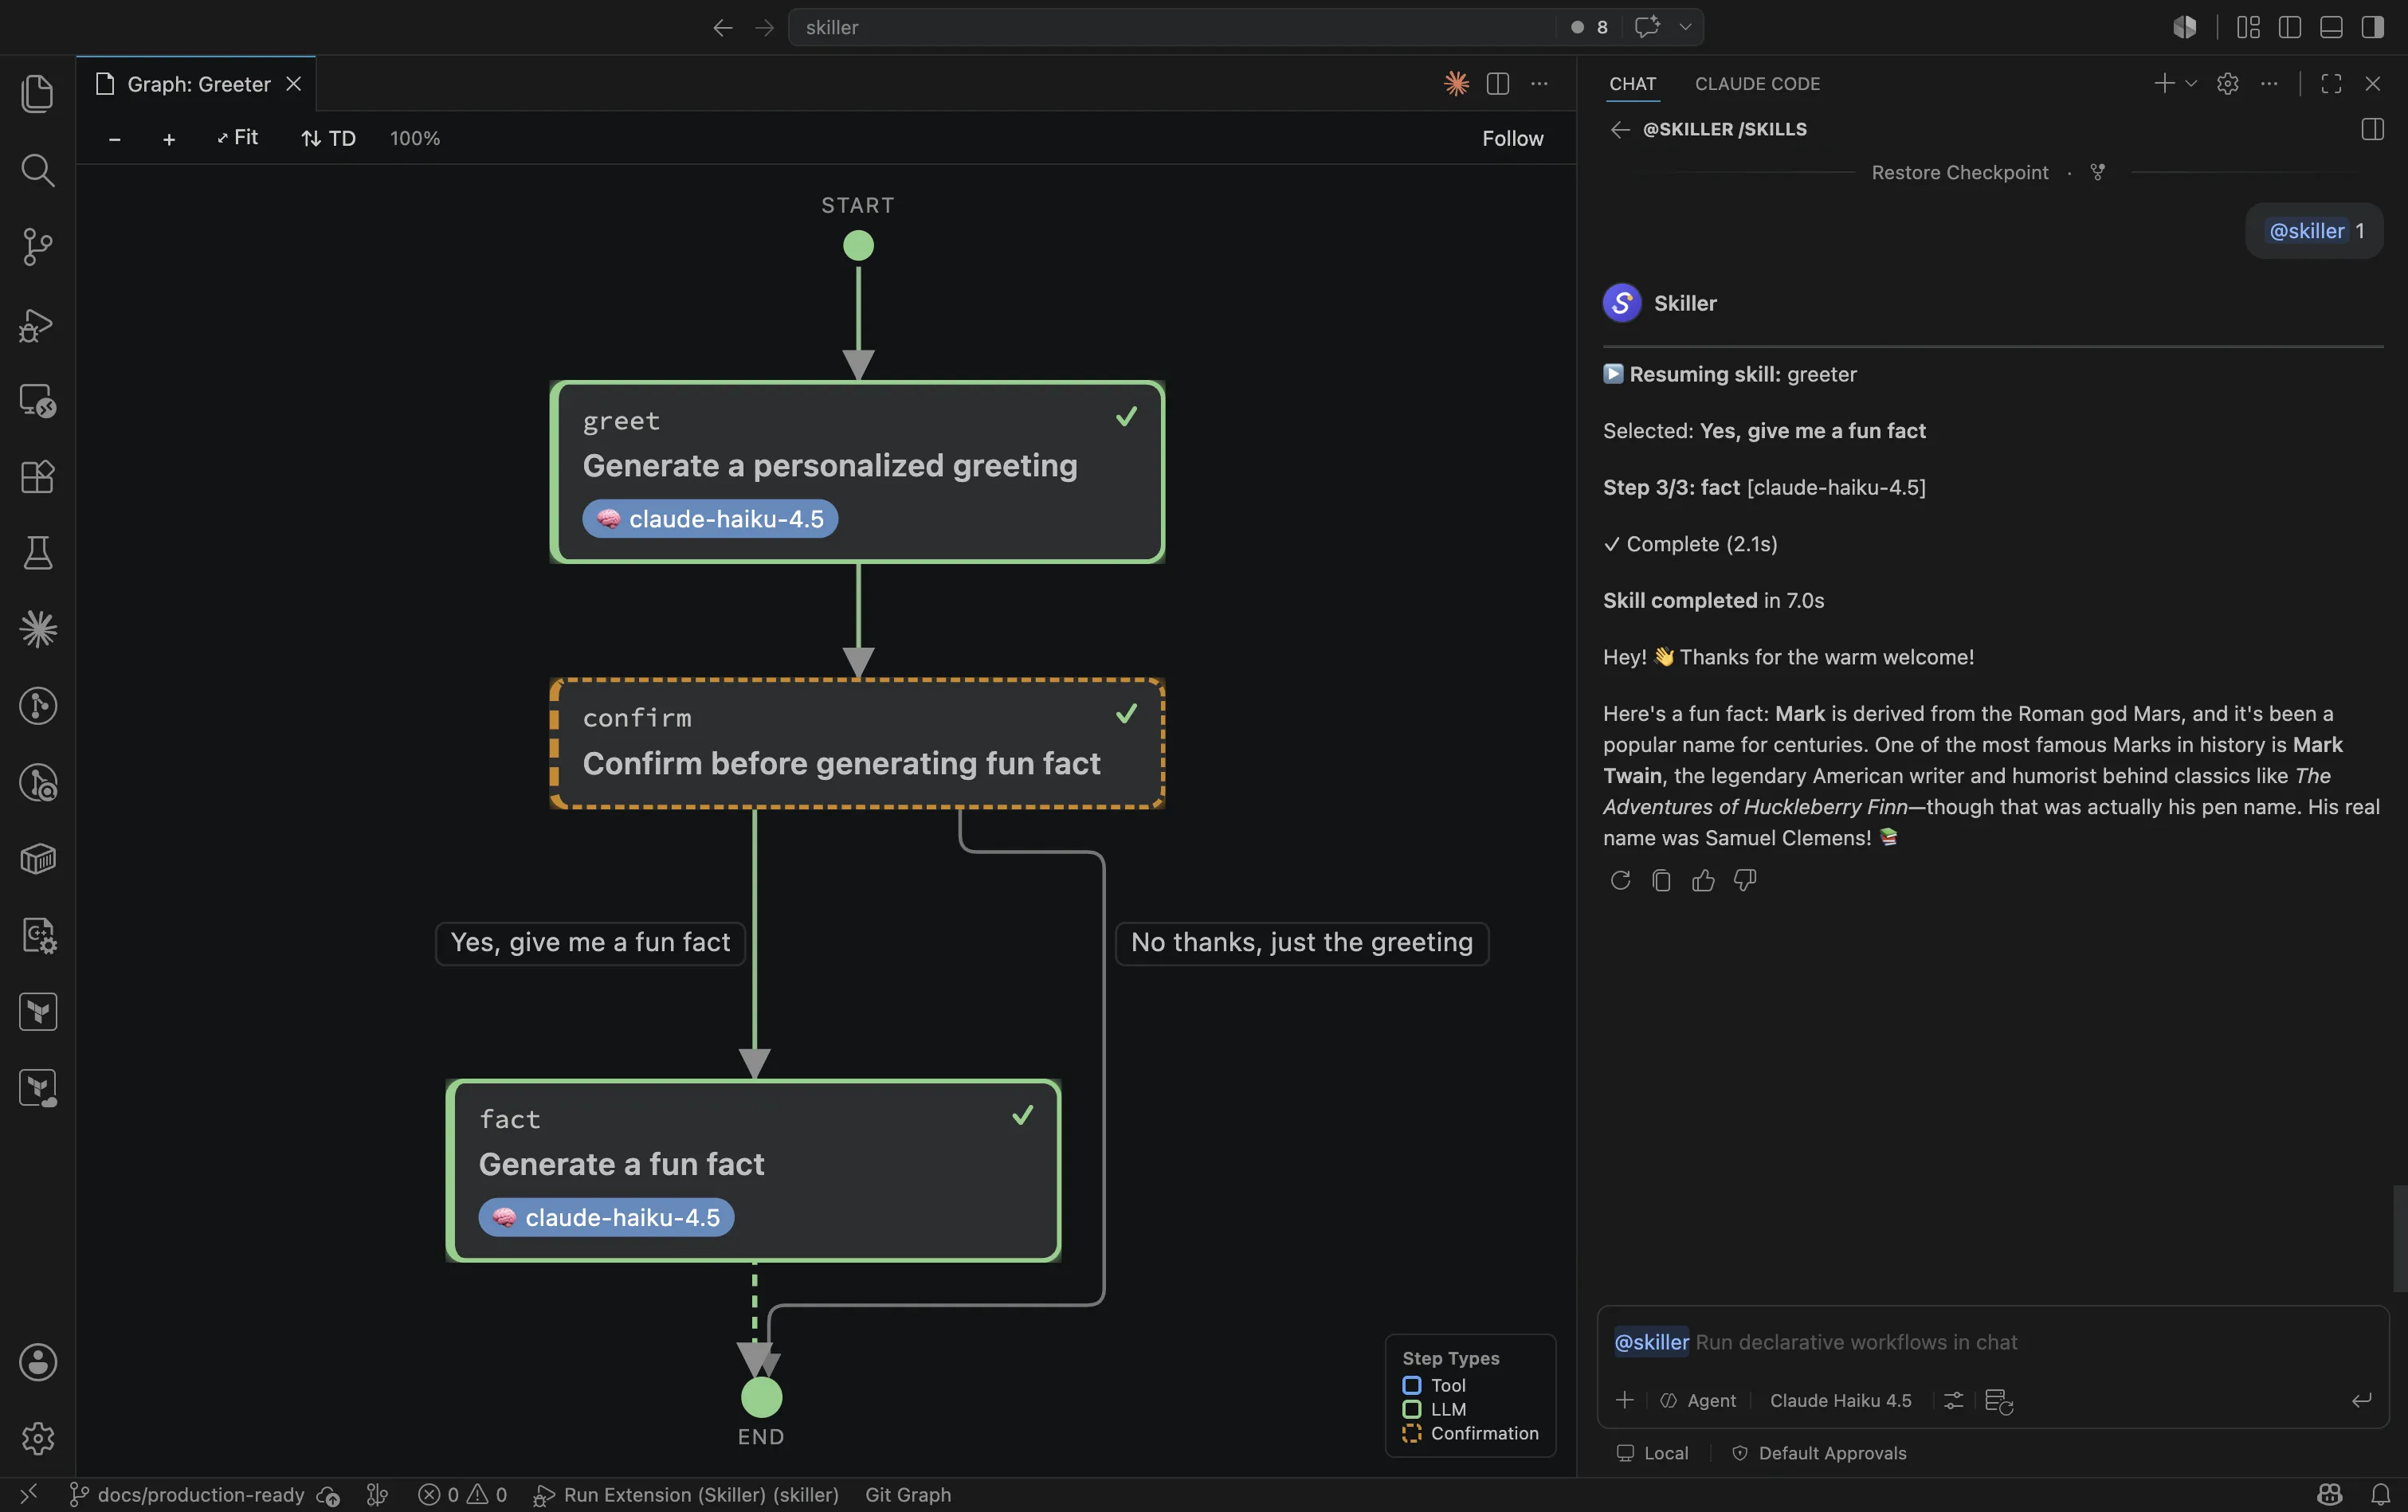
The renderer
Section titled “The renderer”The graph is laid out by ELK.js and drawn as hand-rolled SVG. Layout and node measurement happen inside the webview; the extension only ships a structural description of the graph. All assets (the layout engine and the pan/zoom helper) are vendored and loaded under a strict Content Security Policy, so the panel works fully offline.
Each node is a card colored by step type — green for llm, blue for tool, orange (dashed)
for confirmation — plus rounded start and end terminals. Cards carry small badges for
the model (🧠) and any tools (🔧) a step uses. A legend in the corner maps the colors to
the three step types.
Live state highlighting
Section titled “Live state highlighting”As a skill executes, the extension streams state into the graph. Each node reflects one of six states:
| State | Appearance |
|---|---|
| pending | dimmed (not yet reached) |
| active | pulsing border + a one-shot pop when it starts |
| awaiting-input | a slower pulse, to read as waiting rather than running (a confirmation paused for your click) |
| completed | a ✓ mark in the corner |
| error | the pulse retinted red |
| skipped | dimmed and dashed (a when condition was false) |
The traversed path is drawn too. The transition currently firing animates as marching
ants (a flowing dashed edge); once the run moves on, that edge settles into a static
“already taken” trail. This is exactly how branches and loops become visible — a backward
goto lights up the edge that jumps back, a forward goto lights up the edge that branches
ahead. Edges carry labels for branch, goto, and loop transitions so you can read the flow
without opening the manifest.
The graph stays in sync even if you switch tabs: when the panel comes back, it re-applies every step’s current state, the terminal states, and the model-override banner from the live run.
Hover inspection
Section titled “Hover inspection”Hover an executed node to peek at what it actually saw and produced. After a short delay, a popover appears with:
- a meta line — the model, duration, tools used, and status;
- the fully-interpolated prompt the step received (templates already rendered);
- for
llmsteps, the model’s response.
The popover has two actions:
- Open ↗ opens the captured prompt/response as a read-only document (under the
skiller-inspect://scheme). It is never writable, so there is no accidental edit and no “save?” prompt — and it refreshes in place when the step re-runs, so a loop always shows its latest iteration. - Copy copies the prompt to the clipboard.
Inspection is available for llm and confirmation steps; tool steps and skipped steps
have no captured prompt/response, so hovering them shows a short “nothing captured” note.
Captured data is session-scoped: it lives as long as the run’s execution state and is
cleared on reset.
This is the single best debugging tool when a prompt isn’t behaving — see Debug a skill.
Navigating the graph
Section titled “Navigating the graph”The toolbar gives you the usual canvas controls:
- Zoom in / out and a Fit button (the current zoom level is shown as a percentage).
- Pan by dragging; mouse-wheel and double-click zoom.
- A direction toggle flips the layout between top-down (TD) and left-right (LR). Your choice is persisted across reloads.
- Follow auto-pans the canvas to the active step as the run advances — handy for long skills where the live step would otherwise scroll off screen. Its on/off state is also remembered.
Click any node to jump straight to that step’s line in skill.yaml. The graph and the
source stay in lockstep.
Open the graph
Section titled “Open the graph”A “Show Graph” CodeLens sits above every skill.yaml. Click it to open (or re-focus)
the panel for that skill — there is one panel per skill, reused on reopen. You can also open it
from chat: @skiller /skills <id> shows a skill’s details and opens its graph in the side panel.
Running a skill from chat also drives whichever graph panel is open for it — the run and its graph stay in lockstep, as in the view at the top of this page.
Live reload and validation
Section titled “Live reload and validation”The panel re-renders as you edit skill.yaml — add, rename, or rewire a step and the graph
updates. If an edit makes the file invalid, the panel surfaces the problem inline:
parse errors and schema-validation errors appear as a banner over the graph
(warnings show as a collapsible panel), so you catch a broken manifest the moment you save
rather than at run time.
Next steps
Section titled “Next steps”- Branch & loop with confirmations — author the control flow this graph animates.
- Debug a skill — use hover inspection and live validation to find problems fast.
- Step types — the
llm,confirmation, andtoolsteps the graph draws. skill.yamlreference — every field the graph reads.